There are many different ways to use AI in business. See three examples of the use of artificial intelligence in business applications.

In my previous article The Different Ways Machines Learn, I described the four common approaches to machine learning:
Within these different approaches, developers use a variety of machine-learning algorithms (An algorithm is a set of rules for solving a problem in a fixed number of steps). So what are machine learning algorithms? Common machine-learning algorithms include decision trees, K-nearest neighbor, K-means clustering, regression analysis, and naïve Bayes, all of which I describe in this post.
A decision tree is a flow chart for choosing a course of action or drawing a conclusion. They are often used to solve binary classification problems; for example, whether to approve or reject a loan application.
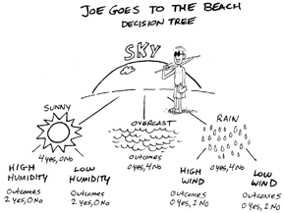
Suppose you wanted to create a decision tree to predict whether or not someone will go to the beach. To create your decision tree, you might start with Sky, which branches off into three possible conditions: Sunny, Rainy or Overcast. Each of these conditions may or may not branch off to additional conditions; for example, Sunny branches off to “85° or Above” and “Below 85°,” and Overcast branches off to “Weekend” and “Weekday.” Making a decision is a simple matter of following the branches of the tree; for example, if the day is sunny and above 85°, Joe goes to the beach, but if the sky is overcast and it’s a weekday, Joe doesn’t go to the beach.
Decision trees are useful for binary classification — when there are only two choices, such as Joe goes or doesn’t go to the beach, a loan application is approved or rejected, or a transaction is fraudulent or not.
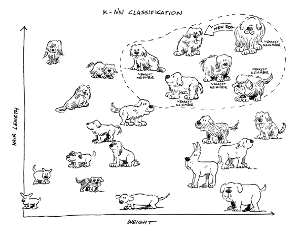
The K-nearest neighbor algorithm classifies data based on similarities, making it very useful for multi-class classification. With K-nearest neighbor, you essentially chart points on a graph that represent known things with certain characteristics, and then identify groups of points that are nearest to each other (the nearest neighbors). The K represents the number of nearest neighbors. K = 1 means only 1 nearest neighbor. K = 2 means two nearest neighbors. The higher the K value, the broader the category or class.
Another very common machine learning algorithm is K-means clustering, which is often confused with K-nearest neighbor (KNN). However, while K-nearest neighbor is a supervised machine learning algorithm, K- means clustering is an unsupervised machine learning algorithm. Another difference is that the K in K-nearest neighbor represents the number of nearest neighbors used to classify inputs, whereas the K in K-means clustering represents the number of groups you want the machine to create.
For example, suppose you have dozens of pictures of dogs, and you want the machine to create three groups with similar dogs in each group. With unsupervised learning, you don’t create the groups — the machine does that. All you do is tell the machine to create three groups, so K = 3.
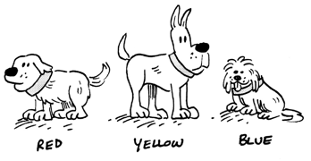
It just so happens that all the dogs have collars and each collar is either red, yellow, or blue. The machine focuses on the collars and creates three groups — one for each color — and assigns dogs to each of those groups based on the color of their collars.
Regression analysis looks at the relationship between predictors and outcomes in an attempt to make predictions of future outcomes. (Predictors are also referred to as input variables, independent variables, or even regressors.) With machine learning (supervised learning to be precise), you feed the machine training data that contains a small collection of predictors and their associated known outcomes, and the machine develops a model that describes the relationship between predictors and outcomes.
Linear regression is one of the most common types of machine learning regression algorithms. With linear regression you want to create a straight line that shows the relationship between predictors and outcomes. Ideally you want to see all your different data points closely gathered around a straight line, but not necessarily touching the line or on the line.
For example, you could use linear regression to determine the relationship between the outdoor temperature and ice cream sales.
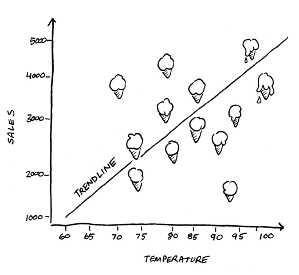
You can see a very clear trendline in this scatterplot diagram; the higher the temperature the greater the ice cream sales. You can also see a few outliers — data points that are far away from the trendline. This could be due to a local festival or because someone had scheduled a birthday gathering at the shop that day. Having a lot of outliers makes it much more difficult to use linear regression to predict ice cream sales.
Naïve Bayes differs considerably from the machine learning algorithms covered so far. Instead of looking for patterns among predictors, naïve Bayes uses conditional probability to determine the likelihood of something belonging to a certain class based on each predictor independent of the others. It's called naïve because it naïvely assumes that the predictors aren't related.
For example, you could use a naïve Bayes algorithm, to differentiate three classes of dog breeds — terrier, hound, and sport dogs. Each class has three predictors — hair length, height, and weight. The algorithm does something called class predictor probability. For each predictor, it determines the probability of a dog belonging to a certain class.
For example, the algorithm first checks the dog's hair length and determines that there's a 40% chance the dog is a terrier, a 10% chance it's a hound and a 50% chance it's a sport dog. Then, it checks the dog's height and determines that there's a 20% chance the dog is a terrier, a 10% chance it's the hound and a 70% chance it's a sport dog. Finally, it checks the dog's weight and figures that there's a 10% chance that the dog is a terrier, a 5% chance that it's a hound and an 85% chance that it's a sport dog. It totals the probabilities, perhaps giving more weight to some than others, and, based on that total, chooses the class in which the dog is most likely to belong.
Naïve Bayes gets more complicated, but this is generally how it works.
One of the critical steps in any attempt at machine learning is to choose the right algorithm or combination of algorithms for the job, but I will reserve that topic for future posts.
There are many different ways to use AI in business. See three examples of the use of artificial intelligence in business applications.
AI planning systems us an area of artificial intelligence which uses a set procedure to solve problems.
Supervised and unsupervised machine learning are two different techniques that you discover insights from your data.